Rancher Monitoring v2 Workshop: Comprehensive Guide
Rancher Monitoring v2 Workshop
Welcome to the Rancher Monitoring v2 Workshop! This workshop is designed to provide a comprehensive guide to deploying, managing, and troubleshooting Rancher Monitoring v2 in Kubernetes environments.
Overview
Rancher Monitoring v2 offers advanced monitoring capabilities for Kubernetes clusters managed by Rancher. It is a powerful tool that integrates Prometheus, Grafana, and other monitoring components to provide deep insights into the health and performance of clusters.
Goals of the Workshop
- Understanding the architecture of Rancher Monitoring v2
- Learning how to deploy and configure Rancher Monitoring v2
- Best practices for monitoring Kubernetes clusters
- Troubleshooting common issues in Rancher Monitoring v2
- Hands-on experience with Rancher Monitoring v2
- Setting up alerts and notifications
- Setting up ingress for Grafana and Prometheus
- Setting up Grafana dashboards
Introduction to Rancher Monitoring v2
- Overview of Rancher Monitoring v2 features
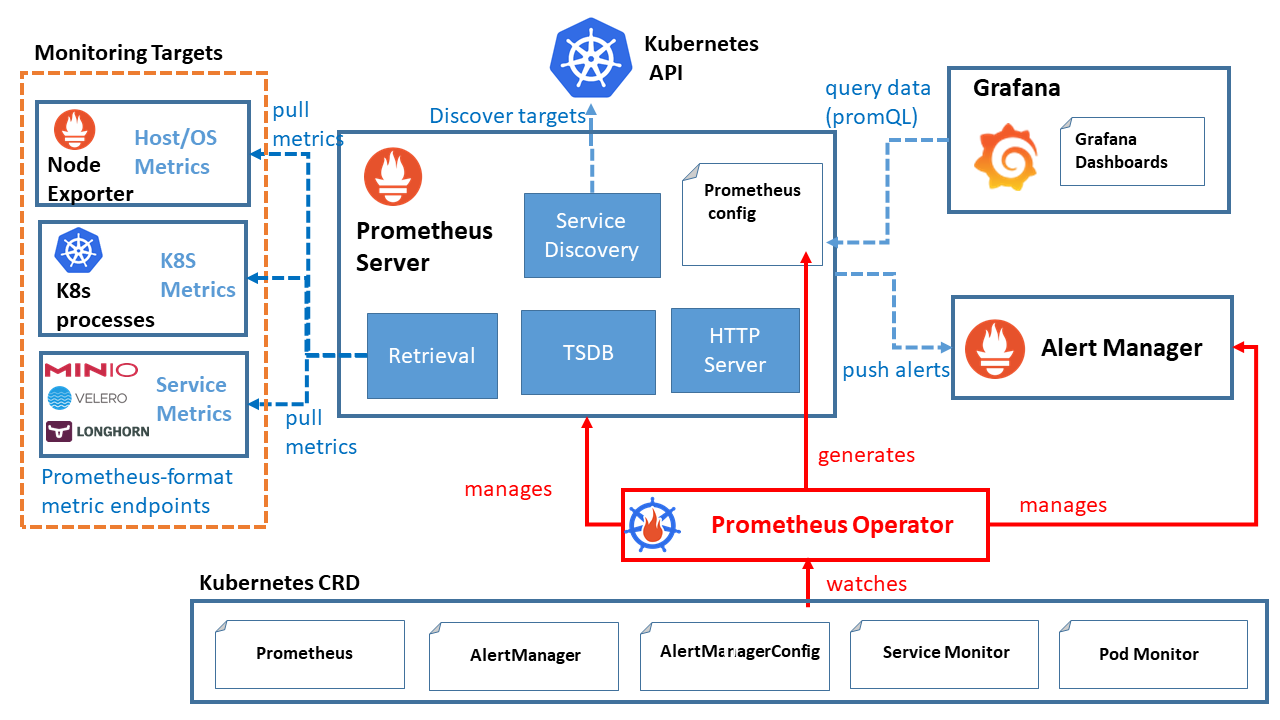
- Architecture and components
Rancher Monitoring v2 Components
- Prometheus
- Grafana
- Alertmanager
- Node Exporter
- Adapters
Rancher Monitoring v2 Architecture
Deploying Rancher Monitoring v2
NOTE: Before deploying Rancher Monitoring v2, you should have a Storage Provider configured in the Cluster IE Longhorn, NFS, etc.
- Browser to the cluster you want to deploy Rancher Monitoring v2 to
- Click “Install Monitoring” in the upper right corner
- The default settings should be fine for most use cases
- Click “Install” to deploy Rancher Monitoring v2
This will trigger a helm install of the monitoring stack into the cattle-monitoring-system namespace. You can monitor the progress of the install by running kubectl get pods -n cattle-monitoring-system -w
Configuring and Customizing
By default, Rancher Monitoring v2 is configured to monitor RKE1/2 and K3s clusters. If you are using a different Kubernetes distribution, you might need to make some changes to the configuration. For example, EKS clusters don’t expose etcd metrics by default, so you will need to disable them in the configuration.
You can find the default values for the monitoring stack in the Rancher Monitoring v2 Helm Chart.
It’s important to note the diffent sections for RKE1/2 and K3s clusters.
For example, if you are using RKE1 rkeControllerManager.enabled should be set to true. If you are using K3s, it should be set to false.
These will deploy different adapters mainly around etcd and other control plane components that give access to the metrics.
Accessing Grafana
Grafana is deployed as a ClusterIP service by default. This means that it is only accessible from within the cluster. To access Grafana from outside the cluster, you will need to expose it using an Ingress or NodePort service.
The easiest way is via the Rancher UI. Navigate to the cluster and the namespace cattle-monitoring-system. Then go to Service Discorvery and Service. Find on the service “rancher-monitoring-grafana” and click on the Target “nginx-http”. This will open a new tab with the Grafana UI which is being proxied by the Rancher UI in the same way you would access it via kubectl port-forward.
NOTE: The default username and password for Grafana is admin/prom-operator. You will want to change this before exposing it to the internet.
The Admin password is stored in a secret called “rancher-monitoring-grafana” in the cattle-monitoring-system namespace. You can get the password by running the following command:
kubectl get secret rancher-monitoring-grafana -n cattle-monitoring-system -o jsonpath="{.data.admin-password}" | base64 --decode ; echo
Accessing Prometheus
For Prometheus, you can use the same method as above to access it via the Rancher UI. The service is called “rancher-monitoring-prometheus” but the UI will not make the port clickable. So you will need to edit the URL in the browser to change the port to 9090.
https://rancher.example.com/api/v1/namespaces/cattle-monitoring-system/services/http:rancher-monitoring-prometheus:9090/proxy/
NOTE: Prometheus by default has no authentication enabled. So you will want to make sure you have some sort of authentication enabled before exposing it to the internet.
Accessing Alertmanager
For Alertmanager, you can use the same method as above to access it via the Rancher UI. The service is called “rancher-monitoring-alertmanager” but the UI will not make the port clickable. So you will need to edit the URL in the browser to change the port to 9093.
https://rancher.example.com/api/v1/namespaces/cattle-monitoring-system/services/http:rancher-monitoring-alertmanager:9093/proxy/
NOTE: Alertmanager by default has no authentication enabled. So you will want to make sure you have some sort of authentication enabled before exposing it to the internet.
Dashboards
Rancher Monitoring v2 comes with a number of pre-built dashboards for monitoring Kubernetes clusters. These dashboards are designed to provide a high-level overview of the health and performance of the cluster. They can be used to quickly identify issues and troubleshoot problems.
Note: Any changes made to the dashboards will be lost when upgrading Rancher Monitoring v2. If you want to make changes to the dashboards, you should create a copy of the dashboard and make your changes there.
Advanced Rancher Monitoring
To get metrics from the Rancher server, you will need to use a third-party tool called prometheus-rancher-exporter. This tool will scrape the Rancher API and expose metrics in a format that can be consumed by Prometheus.
NOTE: This tool is not officially supported by Rancher Labs. It is provided as-is with no warranty or guarantee of support.