Cilium Troubleshooting Guide
Troubleshooting Cilium in Kubernetes can be daunting. This guide provides steps and tools to help diagnose and resolve common issues. Utilize upstream guides and tools for in-depth analysis and health verification of your cluster’s Cilium deployment.
Upstream Guides
Refer to the official Cilium documentation for troubleshooting and performance tuning:
Cluster Health
Ensure that all nodes have a Cilium agent pod in the Running state:
kubectl -n kube-system get pods -l k8s-app=cilium
Cilium agent pods include a CLI for useful commands. To verify the state of an agent:
kubectl -n kube-system exec -it <agent-pod> -- cilium status --verbose
Inspect agent logs for more insights:
kubectl -n kube-system logs --timestamps <agent-pod>
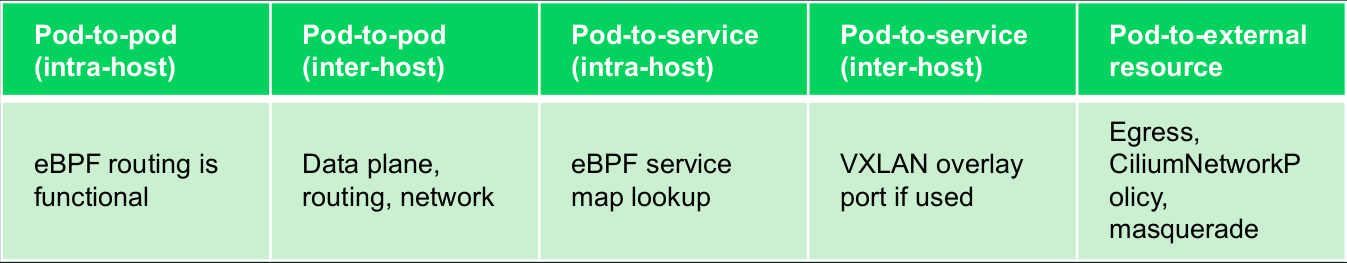
Connectivity Health
Perform upstream validation to ensure proper operation:
kubectl create ns cilium-test
kubectl apply -n cilium-test -f https://raw.githubusercontent.com/cilium/cilium/<cilium_version>/examples/kubernetes/connectivity-check/connectivity-check.yaml
This creates pods to verify connectivity, network policies, etc. All pods must be Running to conclude successful setup. It’s crucial to replace <cilium_version> with your Cilium version.
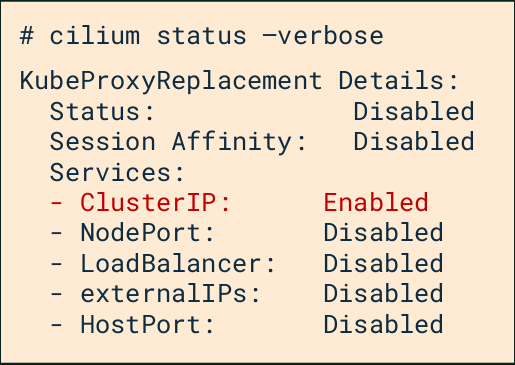
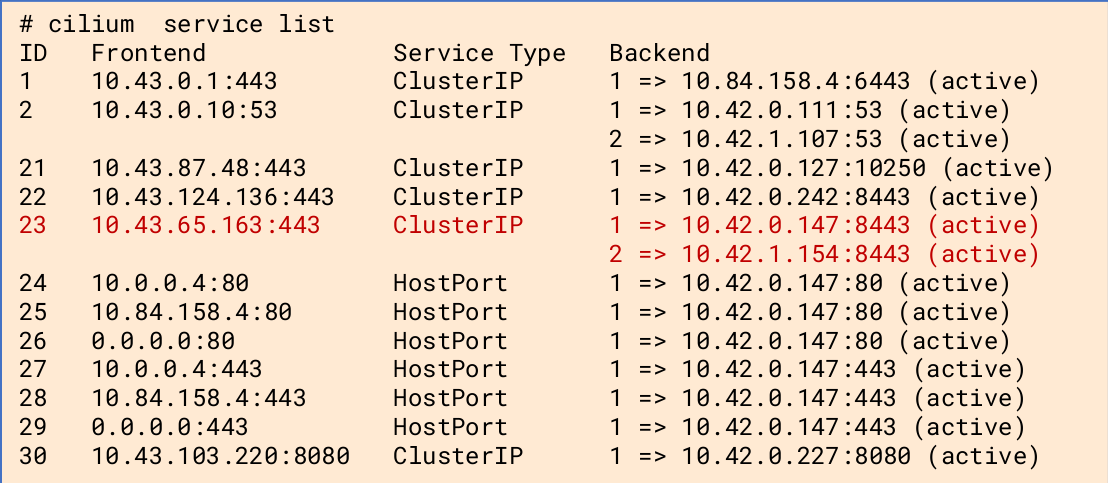
Services
Cilium translates the frontend cluster IP address into a backend pod IP. To list and inspect services:
cilium status --verbose
cilium service list
Endpoint Health & Monitoring
Identify and monitor the health and status of endpoints. To list endpoints:
kubectl -n kube-system exec -it <agent-pod> -- cilium endpoint list
Check the health and status of a specific endpoint by its ID:
kubectl -n kube-system exec -it <agent-pod> -- cilium endpoint health <id>
kubectl -n kube-system exec -it <agent-pod> -- cilium endpoint get <id>
Monitor events for a specific endpoint to troubleshoot connectivity or policy enforcement issues:
kubectl -n kube-system exec -it <agent-pod> -- cilium endpoint monitor --related-to <id>
kube-proxyless
Details for managing services in a kube-proxyless environment using Cilium. For IP masquerading and viewing NAT entries:
kubectl exec -it <agent-pod> -n kube-system -- cilium bpf nat list
For eBPF Conntrack table listings, which help in understanding how connections are being tracked:
kubectl exec -it <agent-pod> -n kube-system -- cilium bpf ct list global
List load-balanced services managed by Cilium:
kubectl exec -it <agent-pod> -n kube-system -- cilium bpf lb list
Miscellaneous
For diagnosing common issues, finding the lxc interface of a pod can be crucial for debugging. To find the lxc interface:
kubectl -n kube-system exec -it <agent-pod> -- cilium endpoint list
kubectl -n kube-system exec -it <agent-pod> -- cilium endpoint get <id>
This provides detailed information about the endpoint, including the lxc interface.
To inspect packets dropped by network policies, which is useful for diagnosing connectivity issues caused by policy misconfigurations:
kubectl -n kube-system exec -it <agent-pod> -- cilium monitor --type drop
Tools
For managing and diagnosing Cilium within your cluster, these tools can be very helpful. To retrieve a Cilium pod managing a particular Kubernetes pod:
curl -sLO releases.cilium.io/v1.1.0/tools/k8s-get-cilium-pod.sh
./k8s-get-cilium-pod.sh <pod> <namespace>
Execute a command in all Kubernetes Cilium pods to help in widespread troubleshooting:
curl -sLO releases.cilium.io/v1.1.0/tools/k8s-cilium-exec.sh
./k8s-cilium-exec.sh <command>
List unmanaged Kubernetes pods, which might not be under Cilium’s control or observation:
curl -sLO releases.cilium.io/v1.1.0/tools/k8s-unmanaged.sh
./k8s-unmanaged.sh
Data Collection
Automate log and state collection for deep analysis. This can be crucial for troubleshooting complex issues or for providing information to support cases:
curl -sLO https://github.com/cilium/cilium-sysdump/releases/latest/download/cilium-sysdump.zip
python cilium-sysdump.zip --nodes <nodes,> --since <duration> --size-limit <size>
Remember to replace <nodes,>, <duration>, and <size> with your specific parameters for targeted data collection.
For more detailed instructions and advanced troubleshooting, refer to the Cilium documentation.